Dashboard Software for Universities
Provide registrars, deans, and department chairs with a real-time view of daily operations, including attendance, class capacity, fee collection, and cross-module alerts so every role sees only the data that matters, updated instantly across the institution.
Dashboard & Analytics Software for Educational Institutions Benefits
Operational Visibility Without the Waiting Period
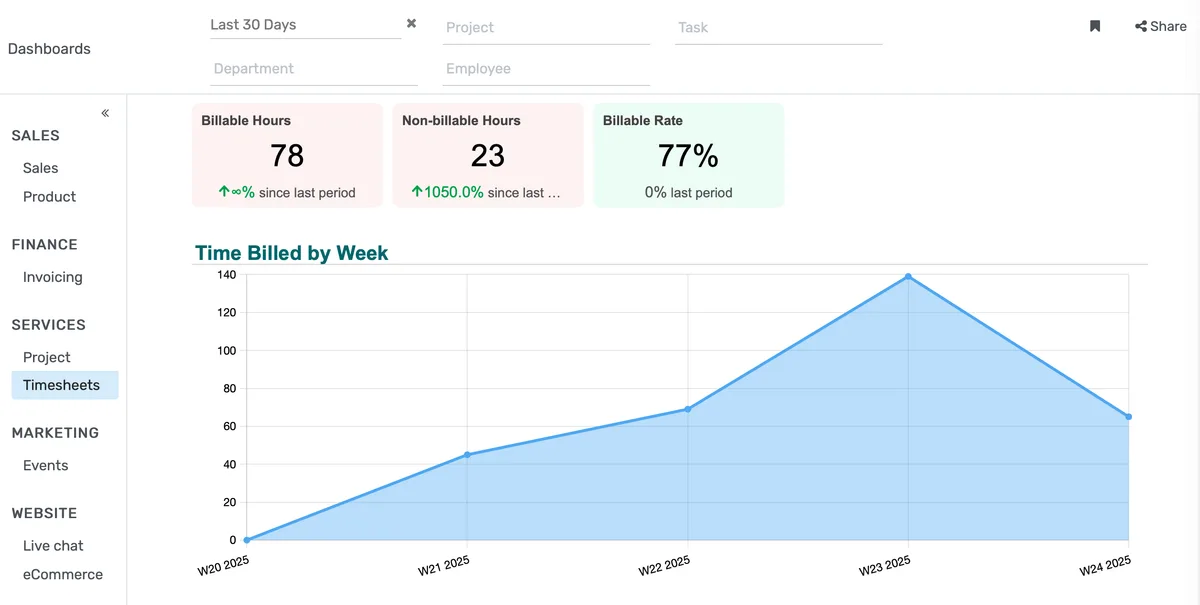
Administrators who currently rely on weekly report packets or end-of-day email summaries can see the same data updated in near real-time across attendance, enrollment, and fee collection, without involving IT or waiting for a batch run.
- Attendance rates across all active sections update within 15 minutes of each class session being recorded by faculty.
- Section fill percentages and waitlist counts are visible in a single table sortable by department, building, or time slot.
- Fee collection status shows outstanding balances by student cohort, with aging indicators for accounts overdue by 30, 60, or 90 days.
Role-Specific Views That Match Actual Job Responsibilities
A provost and a department chair are accountable for fundamentally different things. Forcing both to navigate the same screen wastes time and buries relevant data. Each role gets a configured view containing only the metrics that correspond to their scope of authority.
- The provost view surfaces institution-wide enrollment trends, retention flags by school, and budget-to-actual variance across all colleges, in a single scrollable screen.
- The dean view shows course-level attendance compliance, faculty teaching loads, and grade distribution across their specific college's course catalog.
- The registrar view centers on section capacity management, waitlist escalations, room utilization, and schedule conflict alerts.
Cross-Module Alerts That Surface Problems Before They Escalate
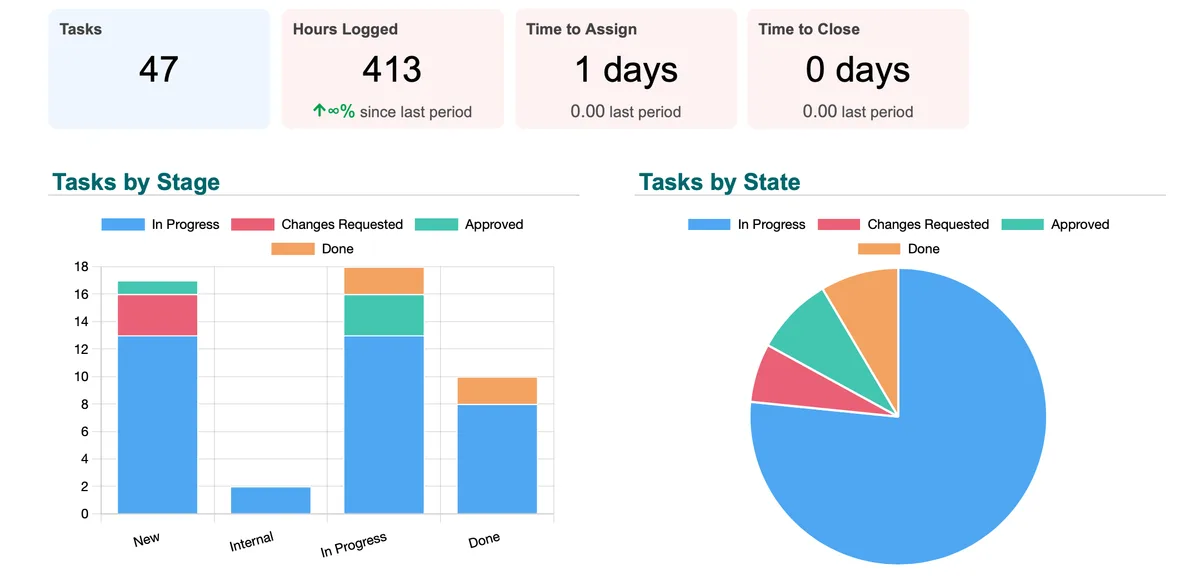
Data problems that require action rarely exist in only one module. A student flagged for low attendance, unpaid fees, and a failing midterm grade is a dropout risk, but no single report has historically connected all three signals. The dashboard cross-references module data and surfaces compound alerts.
- Students meeting two or more at-risk criteria, attendance below threshold, grade below passing, and fee balance outstanding, appear on a combined alert panel visible to advisors and the registrar simultaneously.
- Faculty who have not recorded attendance for more than two consecutive sessions trigger a notification to the relevant department chair, with the session dates and course name attached.
- Sections where more than 20% of enrolled students have not submitted the most recent graded assignment are flagged for instructor follow-up before the grading deadline.
Dashboard & Analytics Software for Educational Institutions Features
Everything you need to manage dashboard & analytics software for educational institutions effectively
Core Management
Essential dashboard & analytics software for educational institutions management capabilities
Student Portal
Self-service portal for students to access information
Basic Reporting
Standard reports and data export functionality
Role-Based Access
Configure user permissions and access levels
Advanced Analytics
Detailed dashboard & analytics software for educational institutions analytics with custom report builder and data visualization
Workflow Automation
Configure automated rules for approvals, notifications, and status transitions
Audit Trail
Complete audit logging of all dashboard & analytics software for educational institutions activities for compliance and accountability
Priority Support
Dedicated support team with SLA-backed response times
Frequently Asked Questions
Get answers to common questions about Dashboard & Analytics Software for Educational Institutions
The KPI Dashboard (feature #53) is built for institutional leadership and board-level reporting, IPEDS metrics, multi-year trend analysis, and accreditation-facing summaries. This operational dashboard is designed for daily management: attendance tracking, section fill rates, fee collection status, and at-risk student flags that registrars, deans, and department chairs need to act on the same day. The two serve different decision cycles and different audiences.
Built for Your Institution Type
See how this feature works for your specific institution
Integrations, Comparisons & Tools
Extend Dashboard & Analytics Software for Educational Institutions with integrations, see how we compare, and calculate your ROI
Related Features
Admission Management
Student registration software that handles online applications, automated reviews, merit lists, and enrollment conversion. Your admissions office processes more registrations with fewer staff hours and fewer errors.
Student Management
Student information system software that keeps every record (academics, health, contacts, documents) in one place. SIS for K-12 schools and universities that gives staff accurate student data instantly and makes reporting effortless.
Course Management
Effortlessly create, organize, and manage courses with a user-friendly platform that streamlines content delivery, tracks progress, and enhances the learning experience for students and educators.
Examination System
Schedule hundreds of exams across multiple rooms without conflicts, generate student hall tickets, and publish verified results in days providing exam controllers smooth logistics and registrars audit-ready records efficiently.
Faculty Management
Manage faculty profiles, balance workloads, coordinate substitutions, track credentials, and conduct performance reviews, freeing department heads from administrative tasks to focus on supporting and empowering teaching staff effectively.
Financial Management
Set up fee structures once, auto-generate invoices at enrollment, accept payments via cash, bank, or online gateways, apply discounts automatically, and reconcile seamlessly - speeding up book closure with fewer errors and calls.
More Strategic Capabilities Features
Explore other features in this category
Ready to Transform Your Dashboard & Analytics Software for Educational Institutions?
See how OpenEduCat frees up time so every student gets the attention they deserve.
Try it free for 15 days. No credit card required.