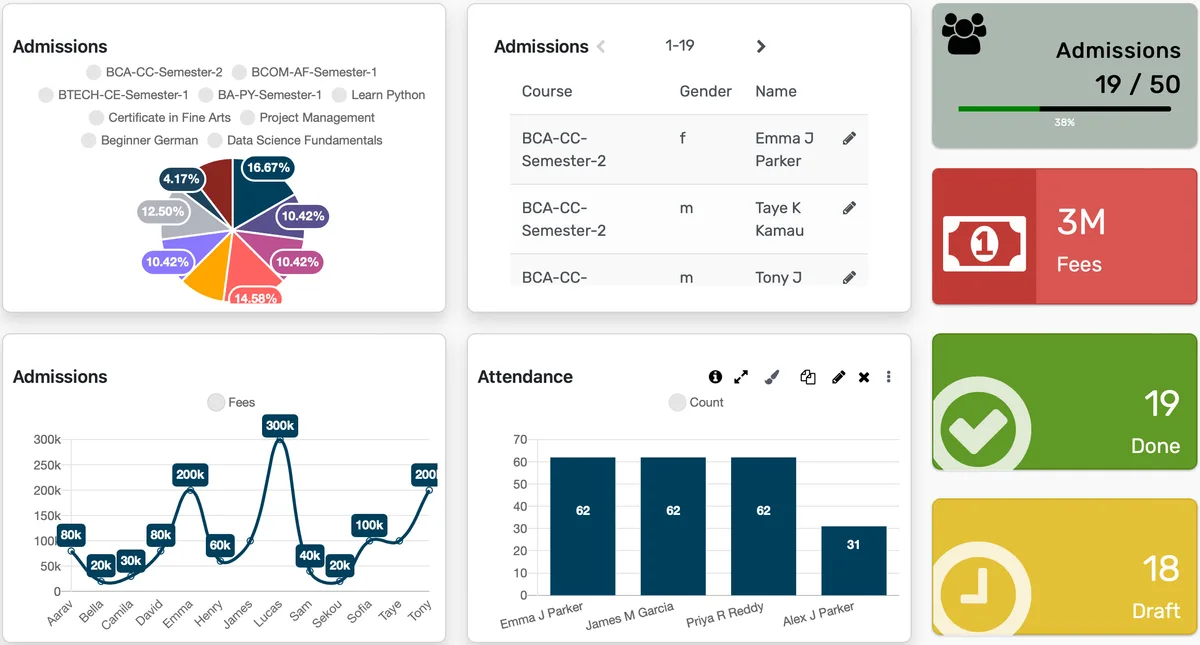
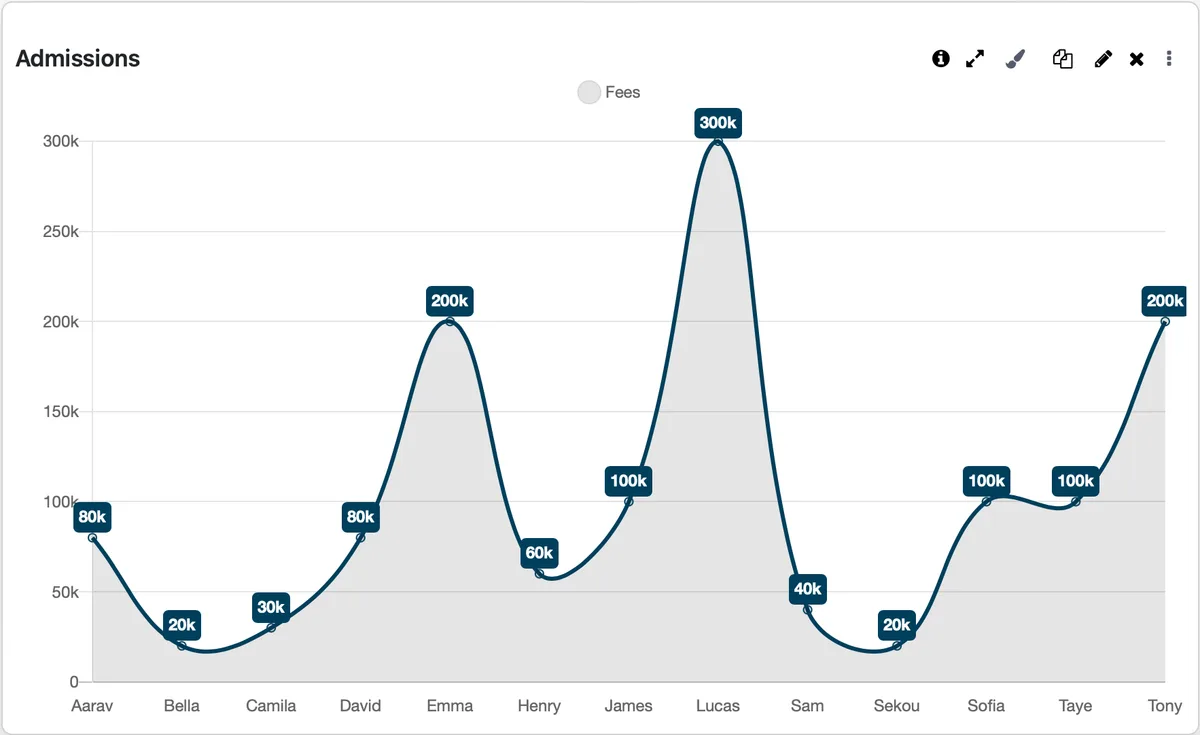
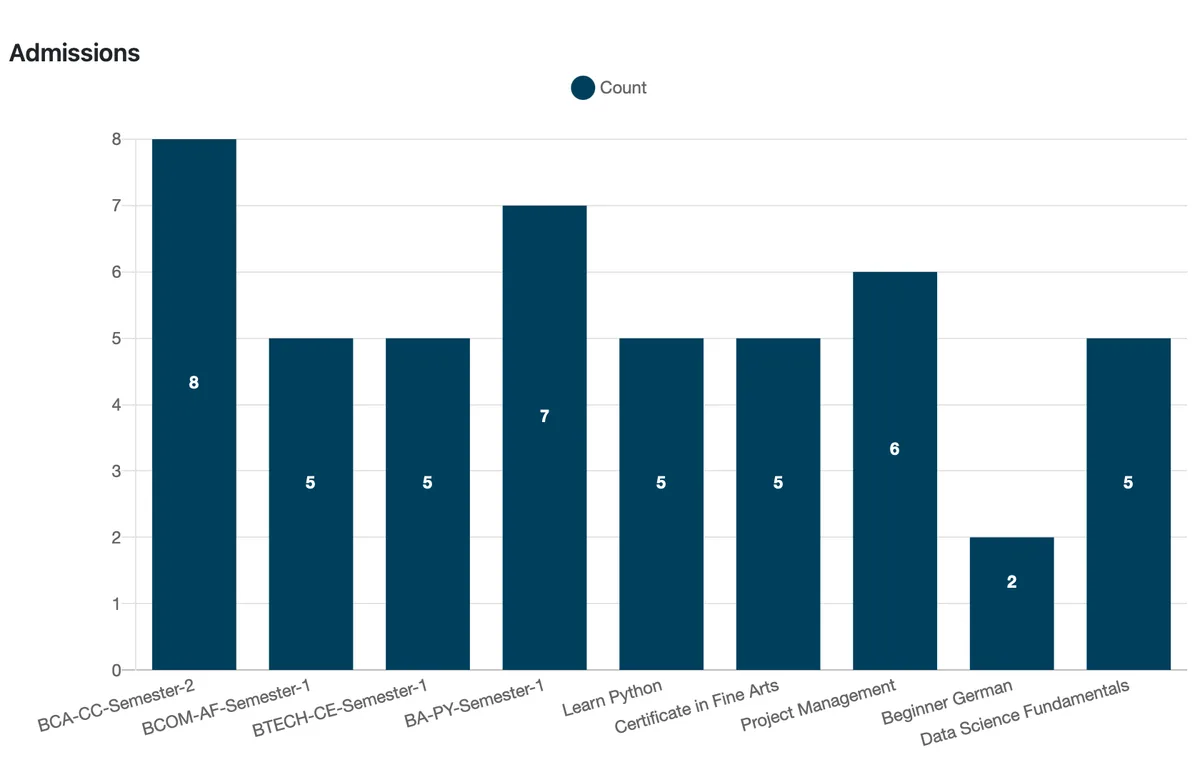
KPI Dashboard for Schools
See enrollment yield, retention rates, budget utilization, graduation trends, and staffing metrics on real-time dashboards built for institutional leadership. Role-based views give presidents, provosts, CFOs, and deans exactly the numbers they need without waiting for IT to run reports or build custom queries.
KPI Analytics Dashboard for Educational Institutions Benefits
Real-Time Institutional Performance Visibility for Every Leadership Role
When your president, provost, CFO, and deans all pull numbers from different systems with different definitions, the cabinet meeting becomes a debate about whose data is correct instead of a discussion about what to do next.
- Presidential dashboard shows enrollment funnel yield rates, retention by college and demographic, budget utilization by division, and strategic plan scorecard with progress indicators against board-approved institutional priorities
- CFO dashboard displays accounts receivable aging by term, budget-to-actual with encumbrance tracking by cost center, revenue per student by program, financial aid disbursement status, and cash flow projections updated daily from the general ledger
- Provost dashboard presents GPA distributions by course level, DFW rates by department, credit hour production by faculty member, program review indicators, and student success metrics disaggregated by entry cohort
Drill-Down from Headline Number to Root Cause in Two Clicks
A single retention rate of 71.4% tells leadership almost nothing. The value is in seeing that Engineering retains 84% while Education retains 58%, and that the gap traces to first-generation students in general studies who lack dedicated advising.
- Click any headline metric to see it disaggregated by college, department, program, student demographic, entry term, and campus, without requesting a custom report from the analytics office
- Historical trend charts overlay the current period against the previous four years on any metric, making it immediately visible whether a number represents improvement, decline, or normal fluctuation
- Threshold alerts flag metrics that cross warning or critical boundaries you define, such as when any program's retention drops below 65% or when budget utilization exceeds 90% before the fourth quarter
Accreditation and Board Reporting That Takes Hours Instead of Weeks
When the regional accreditor asks for five years of retention data disaggregated by student demographics, program, entry cohort, and campus, the answer should not require four people working for a month.
- Accreditation data requests that previously required weeks of manual assembly now produce in minutes because all historical data lives in one system with consistent definitions across every year
- Board-ready reports generate directly from the dashboard with institutional branding, comparative period analysis, variance commentary fields, trend indicators, and drill-down appendices. No PowerPoint assembly required
- Benchmark comparison displays institutional metrics alongside peer group averages, IPEDS data, state benchmarks, and internally set targets on the same chart so leadership can see relative position at a glance
KPI Analytics Dashboard for Educational Institutions Funktionen
Alles, was Sie für eine effektive Verwaltung von kpi analytics dashboard for educational institutions benötigen
Drill-Down
Click to see underlying data and contributing factors
Segmentation
Filter KPIs by program, department, campus, or custom dimensions
Comparison
Side-by-side comparison of periods, segments, or benchmarks
Forecasting
Trend-based projections of future KPI values
Advanced Analytics
Detailed kpi analytics dashboard for educational institutions analytics with custom report builder and data visualization
Workflow Automation
Configure automated rules for approvals, notifications, and status transitions
Audit Trail
Complete audit logging of all kpi analytics dashboard for educational institutions activities for compliance and accountability
Priority Support
Dedicated support team with SLA-backed response times
Häufig gestellte Fragen
Erhalten Sie Antworten auf häufige Fragen zu KPI Analytics Dashboard for Educational Institutions
The dashboard ships with pre-configured metrics across five domains: enrollment (applications, admits, enrolled, yield rate, melt rate by term and program), academic performance (retention rate, graduation rate, GPA distribution, DFW rates, credit hour production), financial (revenue by source, AR aging, budget-to-actual with encumbrances, cost per student), HR (staff turnover, vacancy rate, student-to-faculty ratio), and operational (facility utilization, helpdesk volume, technology adoption). Beyond these, you can create custom KPIs using a visual builder that supports formula-based calculations, multi-source aggregation, weighted composite metrics, and custom dimensions. A dean who wants to track the percentage of sections with fewer than 15 students can define that metric in the builder and add it to their dashboard without involving IT.
Speziell für Ihren Einrichtungstyp entwickelt
Erfahren Sie, wie diese Funktion für Ihre spezifische Einrichtung funktioniert
Integrationen, Vergleiche & Tools
Erweitern Sie KPI Analytics Dashboard for Educational Institutions mit Integrationen, sehen Sie unsere Vergleiche und berechnen Sie Ihren ROI
Verwandte Funktionen
Admission Management
Student registration software that handles online applications, automated reviews, merit lists, and enrollment conversion. Your admissions office processes more registrations with fewer staff hours and fewer errors.
Student Management
Student information system software that keeps every record (academics, health, contacts, documents) in one place. SIS for K-12 schools and universities that gives staff accurate student data instantly and makes reporting effortless.
Course Management
Effortlessly create, organize, and manage courses with a user-friendly platform that streamlines content delivery, tracks progress, and enhances the learning experience for students and educators.
Financial Management
Set up fee structures once, auto-generate invoices at enrollment, accept payments via cash, bank, or online gateways, apply discounts automatically, and reconcile seamlessly - speeding up book closure with fewer errors and calls.
Examination System
Schedule hundreds of exams across multiple rooms without conflicts, generate student hall tickets, and publish verified results in days providing exam controllers smooth logistics and registrars audit-ready records efficiently.
Faculty Management
Manage faculty profiles, balance workloads, coordinate substitutions, track credentials, and conduct performance reviews, freeing department heads from administrative tasks to focus on supporting and empowering teaching staff effectively.
Weitere Strategic Capabilities Funktionen
Weitere Funktionen in dieser Kategorie erkunden
Bereit, Ihre KPI Analytics Dashboard for Educational Institutions zu transformieren?
Erfahren Sie, wie OpenEduCat Zeit freisetzt, damit jeder Studierende die Aufmerksamkeit erhält, die er verdient.
15 Tage kostenlos testen. Keine Kreditkarte erforderlich.